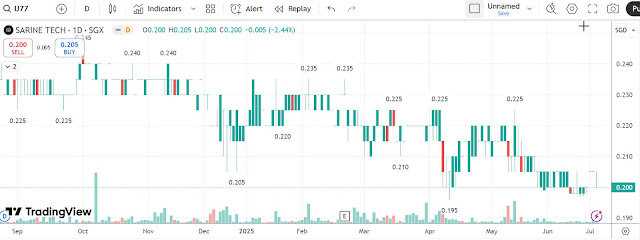
SARINE TECH (U77.SI) – SGX | Daily Chart | Sep 2024 – Jul 2025 | ~200 Bars
Market Regime: Transitioning from Ranging to Weak Downtrend
🔍 1. Market Structure & Order Flow Analysis
-
Swing Highs (SH):
-
0.240 (Oct, Nov 2024)
-
0.235 (Feb, Mar 2025)
-
0.225 (May 2025)
-
-
Swing Lows (SL):
-
0.205 (Dec 2024)
-
0.195 (Apr 2025)
-
0.195 (Jun 2025)
-
0.200 (Current Bar Holding Above)
-
-
Structure Status:
-
Lower highs and lower lows from 0.240 → 0.235 → 0.225 → 0.210 → 0.195
-
Weak downtrend confirmed, but momentum flattening in recent bars (sideways grind near 0.195–0.205)
-
-
CHoCH Zone:
-
A daily close >0.210 would represent a Change of Character, suggesting early bullish interest.
-
-
Trend Momentum:
-
Decreasing bar ranges with overlapping candles suggest trend exhaustion and absorption.
-
🧭 2. Volume-Price Relationship (VPR) Analysis
-
Volume Spike @ 0.195 (Apr 2025):
-
Wide-range down bar on high volume, likely a climactic sell bar or capitulation low.
-
-
Recent Volume Context (June–July):
-
Multiple tight-range bars with low-to-moderate volume, indicating volume dry-up – typically precedes directional move.
-
-
Effort vs. Result (Recent):
-
Moderate effort (volume) with minimal downside continuation = potential absorption at 0.195–0.200 zone.
-
🏛 3. Institutional Footprint Recognition
-
Liquidity Grab Evidence:
-
False breakdown wick below 0.195 (Apr) followed by immediate reversal → possible spring action (Wyckoff).
-
-
Accumulation Signs (Developing):
-
Price pinning 0.200 with repeated failed breakdown attempts, volume absorption → accumulation potential.
-
-
Order Block:
-
Bullish order block near 0.195 (April’s low bar with volume spike) → structural demand zone.
-
🧱 4. Bar Pattern Recognition
-
Recent Bars (June – early July):
-
Multiple inside bars near support → coiled price action.
-
Narrow range Doji/spinning top bars show indecision, building tension.
-
-
Reversal Signal (Pending Confirmation):
-
Need for bullish engulfing + volume spike to confirm spring action out of base.
-
🌐 5. Multi-Timeframe Confluence
-
Likely Weekly Chart Bias:
-
Weak bearish to neutral bias with flat structure. Weekly HL needed above 0.210 for full transition.
-
-
Key Compression Zone:
-
Daily and likely weekly support overlap at 0.195–0.200 = high-probability demand zone.
-
🧠 6. Psychological Levels & ATR Consideration
-
0.200 = Round Number Magnet:
-
Price defending this level repeatedly = psychological support.
-
-
ATR Compression:
-
Volatility compressed post-April = potential for volatility expansion upon breakout.
-
⚠️ 7. Risk-Adjusted Setup Identification
-
High-Probability Accumulation Zone:
-
0.195–0.200 = tight risk zone with high structural relevance.
-
-
Stop Placement:
-
Below 0.190 (beneath structure + liquidity sweep area)
-
-
Initial Profit Target:
-
0.210 (CHoCH + minor resistance)
-
0.225 (next swing high)
-
-
R:R Potential:
-
Entry at 0.200, Stop at 0.190, Target at 0.225 = 1:2.5 R:R
-
✅ Summary Analysis
-
Market Regime: Weak downtrend transitioning to potential accumulation.
-
Conviction Observations:
-
Repeated defense of 0.200 zone with volume dry-up = accumulation footprint.
-
Liquidity grab at 0.195 + spring-like action, no follow-through breakdown = institutional support.
-
Inside bar clusters + volatility compression = imminent directional expansion likely.
-
Volume absorption patterns with minimal price progress suggest smart money presence.
-
Price trading at round number support with low-range candles = retail indecision vs. smart money stealth.
-
📌 Forward Bias & Execution Zones
-
Trade Summary:
Buying SARINE TECH near 0.200 because of structural absorption and volatility compression, with stops at 0.190 targeting 0.225 for 1:2.5 risk-reward. -
Confidence Rating: 7.5 / 10
-
Key Levels to Watch:
-
Support: 0.195 (demand zone)
-
Resistance: 0.210 (CHoCH), 0.225 (swing high)
-
Breakout Confirm: Close above 0.210 with volume
-
-
Pre-Execution Checklist:
✅ Confirm breakout candle with above-average volume
✅ Ensure no major bearish catalyst
✅ Align with broader sector strength
✅ Manage size per 1R = max 1–2% account risk
Disclaimer:Please note that this analysis is for educational purposes only and should not be taken as investment advice. Trading involves significant risk, and you should consult with a financial advisor before making any decisions.
Dividend: 5.00%

No comments:
Post a Comment