Showing posts with label STI ETF. Show all posts

Monday, May 26, 2025

STI ETF - 26 mAY 25

(SPDR Straits Times Index ETF, Ticker: ES3.SI, Exchange: SGX) on the daily (1D) timeframe.


🔍 1. Trend Analysis

✅ Overall Trend:

  • Medium-Term: The ETF has been in a broad uptrend since the October 2023 low (~3.30).

  • Recent Swing Structure:

    • Higher Lows: 3.560 → 3.801 → 3.393 (April low), followed by recovery.

    • Higher Highs: 3.925 → 3.979 → 4.000 → 4.012.

  • Despite the sharp drop in early April, the index held key support and has since recovered robustly to just under resistance.

📉 Trend Weakness Signs (Late May):

  • Recent candles around 3.95–4.00 show smaller range bars, suggesting loss of bullish momentum.

  • Volume has decreased during consolidation after the April recovery — suggests possible exhaustion or indecision.


🔑 2. Key Price Action Signals

📈 Strong Trend Bars & Follow-Through:

  • March 2024 to early April:

    • Strong bullish momentum toward the 4.012 peak.

    • March 25–April 2: Tall green bars leading to new high at 4.012 — strong buyers present.

  • April 3–April 10: Heavy red bars + spike in volume → sharp breakdown to 3.393 — classic bearish breakout bar, likely news-driven.

🔄 Reversal Patterns:

  • April 10–April 22: Strong bullish engulfing candles off the 3.393 low, coinciding with highest volume in the chart — institutional buying support.

  • May 6–May 20: Consolidation near 3.95–4.00 shows dojis and small real-body candles, potential pause before breakout or pullback.

🔍 Inside Bars / Dojis:

  • Several inside bars during mid-February to March around the 3.850–4.000 range show compression before breakout.

  • Dojis in May suggest indecision as price retests resistance.

🚨 Volume Spikes:

  • April 3–4: Significant spike in red volume, wide-range down bar → bearish breakdown.

  • April 12–16: High volume rebound bars (green), with closing near highs → bullish absorption & reversal confirmation.

  • Post May 10: Volume drops despite higher prices → waning demand near resistance (possible bull trap forming).

📊 Gap Analysis:

  • Gap down on April 3 was not immediately filled and followed by sell-off → clear continuation gap.

  • No visible gap-ups during this phase, but steady bars up from April 12 suggest gradual accumulation.


📏 3. Support & Resistance Zones

Price Level (SGD)TypeObservations
4.012 – 4.000Major ResistancePrevious swing high. Double-tested, not broken yet.
3.850 – 3.801Support ZoneConsolidation before recent rally. Strong zone.
3.393Major SupportVolume spike low, April bottom. Institutional demand.
3.560Intermediate SupportMid-November swing low. Secondary pullback area.

📈 4. Breakout & Pullback Analysis

✅ Breakouts:

  • Late Dec → Jan: Break above 3.925 was strong with follow-through.

  • April recovery: Break above 3.850 was high-volume bullish reversal, strong conviction.

⚠️ Weak Breakout Signals:

  • May candles approaching 4.00 are small-bodied, with decreasing volume, suggesting lack of breakout strength.

🔄 Pullbacks:

  • April 3–10: Sharpest pullback with demand confirmation (bullish engulfing near support).

  • Pullbacks tend to respect prior S/R levels (3.850, 3.801).


🌐 5. Market Context & Trading Bias

  • Current Context: Post-recovery ranging just under key resistance.

  • Bias: Neutral to mildly bullish in short term, due to strong rebound off 3.393 and current consolidation near highs.

  • Warning: Failing to break 4.00 with volume may signal short-term correction or range continuation.


💧 6. Supply, Demand & Liquidity Analysis

  • April 3–10: Bear trap. Volume surged at lows, price reversed — clear institutional accumulation.

  • Liquidity Trap Potential: Breakout above 4.00 without volume confirmation may attract breakout traders, but fail → bull trap scenario.

  • Trade Setup Opportunity:

    • Pullback Buy near 3.850–3.900 zone if breakout fails.

    • Breakout Play above 4.012 with volume spike confirmation (above 2x average).


💼 7. Risk Management Strategy

Trade Idea: Breakout Above 4.012

  • Entry: 4.02 (above resistance with volume confirmation).

  • Stop-Loss: Below 3.90 (last pivot low).

  • Target 1: 4.15 (approx 3.7% gain).

  • Target 2: 4.25 (round number & psychological resistance).

Alternate Idea: Pullback Buy

  • Entry: 3.88 (support zone).

  • Stop-Loss: 3.79.

  • Target: Retest of 4.00.


📰 8. Company News (Last 3 Months)

✅ Key News Items (SPDR STI ETF - ES3.SI):

  1. April 2025 – MAS Policy Announcement Impacted Market

    • Date: April 3–5

    • Summary: MAS decision to hold monetary policy unchanged amid global headwinds spooked local equity markets, leading to a short-term sell-off. Investors feared slowing regional growth.

    • Impact: Triggered the sharp drop to 3.393 (seen in the chart).

  2. May 2025 – Singapore GDP Revised Upwards

    • Date: May 15

    • Summary: Singapore's Q1 GDP revised upward to 2.6% from 2.3%. Sectors like finance and tech rebounded.

    • Impact: Provided macro tailwinds for STI ETF. Price held near highs but showed low momentum.


📌 Final Summary & Timeframe Bias

TimeframeTrendBiasComment
Short-TermRanging (3.95–4.00)Neutral → Bullish (if breakout confirmed)Watch for breakout above 4.012 with volume.
Medium-TermUptrendBullishHealthy recovery from April sell-off.
Long-TermBullishBullishContinues series of higher highs/lows from Oct 2023.

Disclaimer:Please note that this analysis is for educational purposes only and should not be taken as investment advice. Trading involves significant risk, and you should consult with a financial advisor before making any decisions.

Dividend:   4.48%


Monday, May 19, 2025

STI ETF - 19 May 25

Stock: STI ETF (SPDR Straits Times Index ETF)
Ticker: ES3.SI
Exchange: SGX (Singapore Exchange)
Timeframe: Daily (1D)
Date of Last Candle: 19 May 2025
Current Price: 3.955 SGD
Change: -0.016 (-0.40%)


1. 📈 Trend Analysis

✅ Current Trend:

  • Medium-Term: Uptrend with a recent sharp recovery.

  • Short-Term: Bullish rally after a V-shaped bottom in early April (low: 3.393).

  • Long-Term: Generally consolidative with upward bias, forming a broad ascending channel since October 2023.

🔍 Higher Highs / Higher Lows:

  • Key Higher Lows: 3.560 → 3.801 → 3.393 (false breakdown, strong reversal)

  • Higher Highs: 3.709 → 3.925 → 3.979 → 4.012

⚠️ Trend Weakening Signs:

  • The most recent bar (19 May) is bearish, closing lower despite reaching a high of 3.986 (near resistance).

  • The last 3–4 bars have shorter bodies, indicating momentum slowing near resistance (3.955–3.98 zone).


2. 🔔 Key Price Action Signals

🔹 Volume Spike + Sharp Reversal (April 2025):

  • 3.393 low followed by high volume bottom reversal, large bullish bars with minimal wicks.

  • Classic demand zone reaction — institutional buying likely at this support.

🔹 Pin Bars / Rejection Candles:

  • Several small-body candles with wicks near 4.00–4.012 in Feb & April, signaling strong supply zone.

  • Last bar on May 19: Slight upper wick shows intraday rejection near 3.986 → short-term resistance validation.

🔹 Gap Down (Early April):

  • Price gapped down heavily into the 3.4s, followed by a dramatic recovery → bull trap reset / liquidity grab.

🔹 Strong Bullish Trend Bars (Mid-April):

  • Long-bodied green candles closing near highs post 3.393 → indicative of strong institutional demand.


3. 📌 Support & Resistance Levels

🟢 Support Zones:

  • 3.393 – 3.45 (high volume reversal zone)

  • 3.801 – 3.85 (previous resistance-turned-support)

  • 3.560 (Oct–Nov base)

🔴 Resistance Zones:

  • 3.98 – 4.012 (Repeated rejection, horizontal resistance from Jan–April)

  • 4.00 (psychological barrier) – Significant selling seen around this level.


4. 🚩 Breakout & Pullback Analysis

  • Breakout Attempt (Late April - Early May): Strong vertical rally from 3.393 to 3.955. However, no volume spike confirms the 4.00 breakout — needs confirmation.

  • Pullback Areas: If rejected from 4.00 area, watch for retests of:

    • 3.85–3.88: Previous micro consolidation

    • 3.801: More meaningful structural support

  • Flag Formation:

    • Possible bull flag forming around 3.95 resistance, awaiting breakout or rejection signal.


5. 🧭 Market Context & Trading Bias

📉 April Selloff → Liquidity Grab

  • Aggressive liquidation (early April), large volume and spread, then sharp reversal = bear trap likely triggered.

📈 May Rally:

  • Sustained buying pressure, low-wick candles indicate high conviction bulls.

  • Market psychology: From fear (April) to greed/optimism (May) — now entering indecision (near resistance).


6. 📊 Supply, Demand & Liquidity Analysis

  • Supply Zone: 3.98 – 4.01 (multiple rejections, declining momentum here)

  • Demand Zone: 3.393 – 3.55 (volume-based strong reversal)

  • Volume confirms institutional demand at lows and profit-taking/supply at highs.

  • Liquidity Trap Observed in early April (stop-hunt before rally) – text-book reversal setup.


7. ✅ Trade Setups & Risk Management

🎯 Setup 1: Breakout Play

  • Entry: Above 4.02 (confirmed breakout of Feb high)

  • Stop: Below 3.90 (below mini-flag structure)

  • Target: 4.20 (projected range breakout)

  • RR: ~2.5:1

🎯 Setup 2: Pullback Buy

  • Entry: 3.85–3.88 (minor demand)

  • Stop: Below 3.80

  • Target: 3.98 / 4.01


8. 📰 Company News Summary

News search (Last 3 Months):

  • ✅ April 2025 – Singapore GDP Growth Surprises to the Upside

    • GDP grew at 2.1% YoY vs expected 1.5%. STI ETF rebounded strongly post announcement.

    • Sentiment: Positive macro catalyst.

  • ✅ May 2025 – MAS Keeps Monetary Policy Unchanged

    • No tightening; dovish stance helps equities.

    • STI rallied further after announcement.

    • Sentiment: Bullish for equities.

  • ⚠️ March 2025 – Temasek Trims STI ETF Holdings

    • Institutional selling partly triggered April dip.

    • Sentiment: Short-term bearish, but eventually absorbed by buyers.


🧠 Final Analysis & Trading Bias

Short-Term (1–2 weeks):

Neutral to Bullish Bias

  • Consolidation under resistance. Need breakout above 4.012 to sustain rally.

Medium-Term (1–3 months):

Bullish Bias

  • Strong recovery from major demand. Potential for continuation to new highs if 4.00 breaks.

Long-Term (>3 months):

Mildly Bullish / Range Bias

  • Structural resistance around 4.00 has capped upside for over 6 months. Needs macro catalyst or strong volume breakout to overcome.


🧾 Conclusion:

STI ETF (ES3.SI) is testing major resistance at 3.955–4.012, with a strong V-bottom reversal from April lows. The rally is healthy but now facing profit-taking and resistance fatigue. Confirmation of a breakout above 4.012 with volume will trigger a move toward 4.20+. Risk remains to the downside if 3.85 fails. Market psychology and macro backdrop support a bullish bias, but short-term caution warranted due to resistance cluster.

📌 Watch List Actionable Zone:
→ Breakout > 4.012 = Buy
→ Pullback to 3.85 = Buy the Dip


Disclaimer:Please note that this analysis is for educational purposes only and should not be taken as investment advice. Trading involves significant risk, and you should consult with a financial advisor before making any decisions.

Dividend:  4.48%


Saturday, April 19, 2025

STI ETF - 17 Apr 2025

STI ETF (SGX: ES3) on the daily timeframe, with the closing price on Thursday, April 17, 2025, at SGD 3.736 (+2.08%).


1. 📈 Trend Analysis

  • Current Trend: Uptrend recovering from a sharp correction.

  • Recent Higher Highs & Lows:

    • Higher highs: 3.925 → 3.979 → 4.000 → 4.012 (top in early April 2025)

    • Sharp drop to a recent low of ~3.30, followed by a rally back to 3.736.

  • Trend Weakness?

    • Yes, in early April: gap downs, strong red candles, and increasing volume (possible panic selling).

    • Now: Trend attempting a V-shape reversal with strong green bars and rising volume.


2. 🔍 Key Price Action Signals

  • Strong Trend Bars:

    • Recent bullish bar (April 17): Large, green, closes near high → indicates buying strength.

    • A few sessions prior: Tall red bars with long bodies, closing near lows → panic selling.

  • Volume Spikes:

    • Major volume spike during the sell-off (~SGD 3.30) = capitulation selling.

    • Rising volume during bounce = short-covering or strong dip-buying.

  • Gap Down: Multiple gap-downs around early April.

    • Resulted in a bear trap as price quickly recovered.

  • Reversal Candles:

    • Pin bar / hammer-like formation around SGD 3.30 → classic reversal signal.

    • Current rally confirms follow-through on reversal.

  • No clear inside/doji bars recently; action has been aggressive and directional.


3. 🧱 Support & Resistance Levels

  • Support Zones:

    • SGD 3.30 (recent low and reversal zone)

    • SGD 3.560 (Nov swing low)

    • SGD 3.801 (March 2025 low)

  • Resistance Zones:

    • SGD 3.850 – 3.854 (multiple rejection candles)

    • SGD 4.00 – 4.012 (double top)


4. 🚀 Breakout & Pullback Analysis

  • Breakdown: Failed support around 3.850 led to a sharp sell-off.

  • Pullback: Current move looks like a strong bullish pullback rally.

  • Flag Formation?: Too early to confirm; watch for continuation above 3.80 with volume.

  • Breakout Strength:

    • Bearish breakout = strong (long bars, high volume).

    • Bullish bounce = strong recovery.


5. 🧠 Market Context & Trading Bias

  • Market Condition: Transitioning from panic selling to recovery.

  • Bias: Bullish short-term if price breaks 3.80 resistance with volume.

  • Trader Psychology:

    • Initial sell-off = Fear

    • Volume spike + hammer = Capitulation

    • Current rally = Dip buyers, short-covering, and growing optimism


6. 📦 Supply, Demand & Liquidity Zones

  • High Demand Zone: SGD 3.30–3.50 (strong volume reversal)

  • Supply Zone: SGD 3.85–4.00 (multiple tops)

  • Liquidity Trap: Possible short traps below 3.50 on gap-downs

  • Trade Setups:

    • Pullback Buy: Entry on dips near 3.65–3.70 with tight stop below 3.60

    • Breakout Play: Above 3.80 with volume confirmation

    • Avoid: Buying directly into resistance without confirmation


7. 🛡️ Risk Management Strategy

  • Entry Idea:

    • Aggressive: Current level (3.736), tight stop below 3.660

    • Conservative: On breakout > 3.80

  • Stop-Loss: Below key swing low (3.660–3.600 zone)

  • Take-Profit:

    • TP1: 3.85 (previous resistance)

    • TP2: 4.00 (psychological and historical resistance)

    • TP3: 4.012 (recent high)


⚠️ Summary

  • Strong bullish momentum after a volume-backed selloff.

  • Confirmation needed above 3.80 for full bullish continuation.

  • Traders should be cautious around resistance and look for confirmation bars with volume.


Disclaimer:Please note that this analysis is for educational purposes only and should not be taken as investment advice. Trading involves significant risk, and you should consult with a financial advisor before making any decisions.

Dividend:  4.74%


Saturday, September 28, 2024

STI ETF - 27 Sep 2024

What does this stock chart says?

STI still bullish.  

Last 3 days look bearish, expect a minor technical correction as the uptrend line was just broken.


Saturday, September 21, 2024

STI ETF - 20 Sep 2024

What does this stock chart says?

5 weeks of up bar, ripe for a technical correction.  

Uptrend Channel

Higher Low Higher High

Dividend Yield  4.31%


Saturday, April 06, 2024

STI ETF - 06 Apr 24

What does this stock chart says?

You are right if you see that the STI is indeed still trap in the long-term down channel.  


Saturday, March 30, 2024

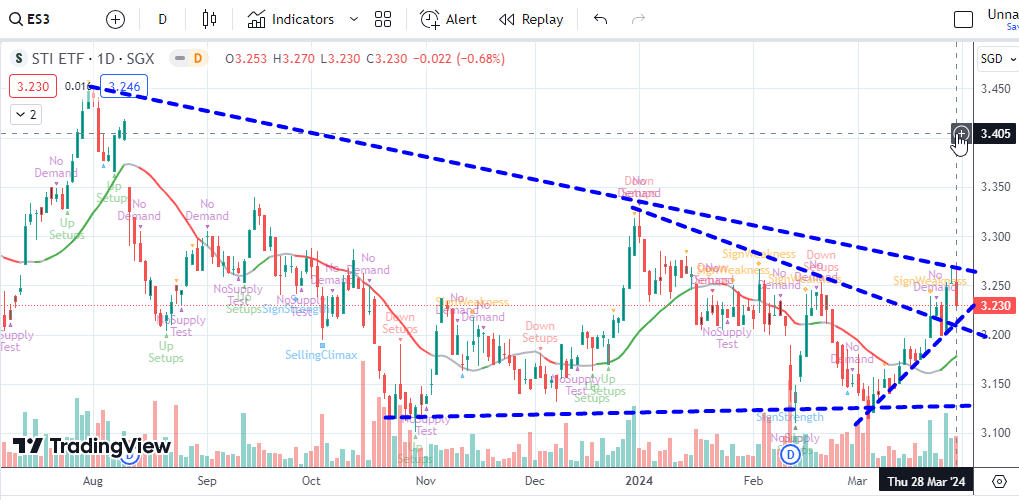
STI ETF - 28 March 2024

What does this stock chart says?

Upper resistance of 3.27 hit, less power to move up.   If falls below support of 3.20, likely to revisit 3.12 support again.


Sunday, March 24, 2024

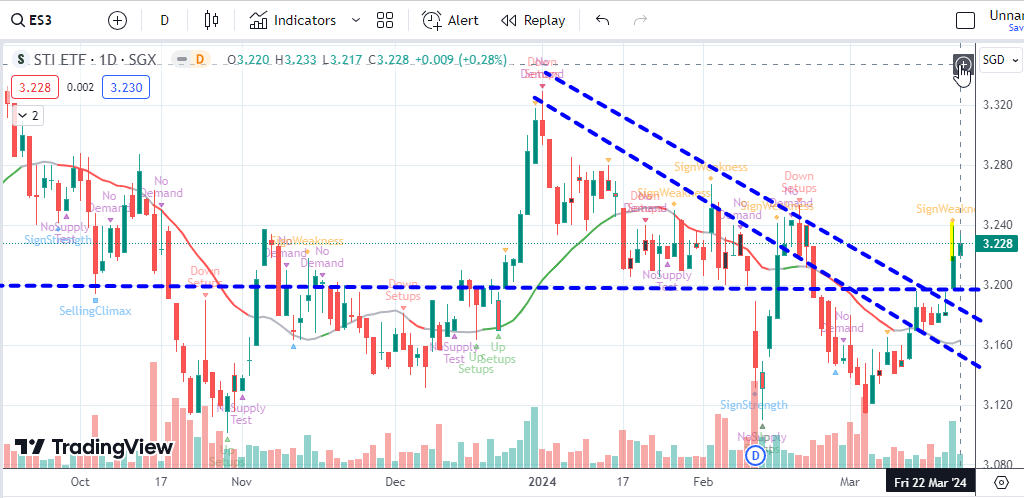
STI ETF - 22 March

What does this stock chart says?

VSA Signal on 21 March 24 showing Sign of Weakness.  

Need to watch that it does not break the support of 3.20


Saturday, December 30, 2023

STI ETF - 29 Dec 2023

What does this stock chart says?

Enter the 3rd of bullish bar, current week is the largest bar.

FED cutting interest rate news is still on play, so far NO new bad news and the rally might stall or continue.  Take note that many stock price are near the incoming resistance.  Need to be cautious even though high can still go higher.  The Greater Fool theory.

My current strategy is to continue to sell some stocks as the STI goes higher as we can never know how high it will go.  Buying will be a no go for now.


Sunday, October 08, 2023

STI ETF - 06 Oct 2023

What does this stock chart says?

The selling climate seem to be over for now.   Likely to be listless next week as market wait for clearer direction. 


Sunday, September 17, 2023

STI ETF - 15 Sep 2023

What does this stock chart says?

Can STI break free from its resistance?  We shall see next week.


Sunday, August 20, 2023

STI ETF - 20 Aug 2023

What does this stock chart says?

STI have been falling for 6th day.  Now price is at it weekly support.  We may have a technical rebound this coming week.


Sunday, July 23, 2023

STI ETF - 21 Jul 2023

What does this stock chart says?

Support line is in ascending mode.  

Trying to break upper resistance which had been holding since April 2023.


Sunday, July 02, 2023

STI ETF - 30 Jun 2023

What does this stock chart says?

STI still in a sideway as well as in an uptrend.  Technical analysis are always face with such blurring line.

A decision may come soon as it touches the lower support line.


Sunday, June 04, 2023

STI ETF - 01 Jun 2023

What does this stock chart says?

Likely to see a technical rebound this coming week as Dow power up by 700 points.  Furthermore, most of the bad news happened in the Sell in May and go away month.  


Sunday, May 21, 2023

STI ETF - 19 May 2023

What does this stock chart says?

Weekly chart is uptrend.

Daily chart in mini-down channel.  Technical rebound would be at 3.30.


Sunday, November 06, 2022

STI ETF - A Bit More To Go

What does this stock chart says?

There is still some room for the STI ETF to move up before hitting the resistance level.  As long as it is in the down channel, the bears are still in control.


Yield at close 3.174

YearYieldTotalAmountEx DatePay DateParticulars
20223.53%SGD 0.112SGD0.0562022-08-112022-08-25Rate: SGD 0.056 Per Security
SGD0.0052022-08-112022-08-25Rate: SGD 0.005 Per Security
SGD0.0052022-02-112022-02-25Rate: SGD 0.005 Per Security
SGD0.0412022-02-112022-02-25Rate: SGD 0.041 Per Security
20212.61%SGD 0.083SGD0.0052021-08-112021-08-25Rate: SGD 0.005 Per Security
SGD0.0332021-08-112021-08-25Rate: SGD 0.033 Per Security
SGD0.0052021-08-112021-08-25Rate: SGD 0.005 Per Security
SGD0.0052021-02-092021-02-24Rate: SGD 0.005 Per Security
SGD0.0282021-02-092021-02-24Rate: SGD 0.028 Per Security
SGD0.0072021-02-092021-02-24Rate: SGD 0.007 Per Security
20203.62%SGD 0.115SGD0.0022020-08-112020-08-25Rate: SGD 0.002 Per Security
SGD0.042020-08-112020-08-25Rate: SGD 0.04 Per Security
SGD0.0172020-08-112020-08-25Rate: SGD 0.017 Per Security
SGD0.0522020-02-102020-02-24Rate: SGD 0.052 Per Security
SGD0.0042020-02-102020-02-24Rate: SGD 0.004 Per Security


Singapore Stock Investment Research