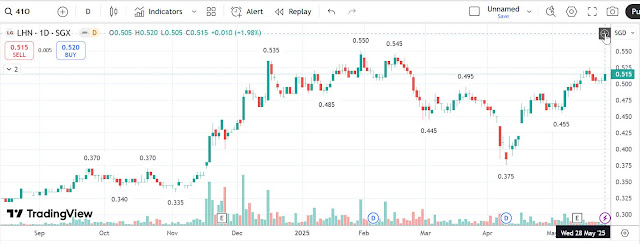
Technical Analysis Report – LHN Limited (SGX: 41O)
Chart Timeframe: 1-Day (Daily)
Exchange: SGX (Singapore Exchange)
Date of Last Candle: 28 May 2025
Price: SGD 0.515 (+1.98%)
1. Trend Analysis
Current Trend: Uptrend
-
Higher Lows:
-
Nov 2024: 0.335
-
Mar 2025: 0.445
-
Apr 2025: 0.375
-
May 2025: 0.455
-
-
Higher Highs:
-
Dec 2024: 0.535
-
Feb 2025: 0.550
-
May 2025: 0.520+
-
Trend Strength
-
Strong bullish impulse starting late Nov 2024.
-
Pullbacks between Jan–Mar 2025 show typical bullish corrections, not trend reversal.
-
Recent movement shows a V-shaped recovery from 0.375 (April low) to 0.515.
Signs of Trend Weakening
-
Feb–Mar 2025: Series of small-bodied candles and overlapping bars after 0.550 peak indicate loss of momentum.
-
No significant bearish engulfing or lower highs yet, so uptrend remains intact.
2. Key Price Action Signals
Volume Spikes & Candle Interpretation
-
Dec 2024: Strong volume on a series of large-bodied bullish candles (0.37 → 0.535).
-
Follow-through seen; breakout confirmed.
-
-
Feb 2025: Spike in volume with long upper wick at 0.550 – potential supply zone.
-
Candle closed well off highs → rejection at resistance.
-
-
Late April 2025: Volume spike during bullish bar off 0.375 low – possible accumulation.
-
May 28, 2025: Bullish bar, closes near high with mild volume uptick → healthy breakout attempt.
Candlestick Patterns
-
Bullish Engulfing:
-
Dec 2024: Large engulfing bar starts sharp leg up.
-
May 2025: Bullish engulfing over prior consolidation bars around 0.485–0.50.
-
-
Rejection/Pin Bars:
-
Feb 2025 (at 0.550): Long upper wick, reversal bar.
-
Mar 2025 (at 0.495): Small body and upper wick → resistance holding temporarily.
-
-
Inside Bars:
-
Multiple during Jan 2025 and Apr 2025 – classic consolidation before breakout.
-
Gap Analysis
-
Minor gap up seen mid-Dec 2024 (0.405 → 0.435): Followed by bullish continuation.
-
No island gaps or exhaustion gaps noted.
3. Support & Resistance Levels
Major Resistance
-
0.550 (double-top near Feb 2025)
-
0.535 (Dec 2024 high)
-
Current short-term: 0.520–0.525 (recent local high, minor resistance)
Major Support
-
0.445 (Feb–Apr 2025 swing low)
-
0.375 (key pivot low, April 2025)
-
0.335 (long-term bottom, Nov 2024)
4. Breakout & Pullback Analysis
-
Breakouts:
-
Dec 2024: Strong with volume, bullish engulfing. Followed by minor consolidation.
-
May 2025: Breaking out of 0.485–0.495 resistance with good structure.
-
-
Pullbacks:
-
Feb 2025 pullback to 0.445 respected bullish structure.
-
April 2025: Deep pullback to 0.375; recovered rapidly, indicating buying interest.
-
-
Trendline / Moving Average Respect:
-
Price remains above prior swing lows, respecting the upward channel.
-
Recovery from pullbacks shows strong demand at higher lows.
-
5. Market Context & Trading Bias
Market Type: Trending (Bullish Bias)
-
Strong recovery from Q1 2025 correction.
-
Recent price action shows renewed buying pressure with continuation signs.
-
Buyer psychology: Greed building as price makes higher highs; pullbacks are shallow.
6. Supply, Demand & Liquidity Analysis
Supply Zones
-
0.535–0.550: Sellers stepped in strongly here before (Feb 2025).
-
Current price action testing these levels again. Watch volume and candle reaction.
Demand Zones
-
0.375: Strong demand evident from bounce in April.
-
0.445: Recent higher low with recovery.
Potential Trade Setups
-
Breakout Play: Entry above 0.520 with stop below 0.495.
-
Pullback Buy: If price retests 0.495–0.500 zone with bullish candle.
-
Invalidation: Close below 0.485 negates bullish structure.
7. Risk Management Strategy
-
Entry (Breakout): Above 0.520
-
Stop-Loss: Below 0.485 (prior resistance/now support)
-
Profit Targets:
-
TP1: 0.550 (previous high)
-
TP2: 0.575 (measured move breakout)
-
TP3: 0.600 psychological level
-
-
Risk-Reward (RR):
-
Risk ~3.5 cents (from 0.520 to 0.485)
-
Reward potential up to ~8–9 cents
-
RR ratio: ~2.5:1 (favorable)
-
8. Company News (Last 3 Months)
1. [27 May 2025 – The Business Times SG]
Headline: LHN to Expand Co-Living Business After Strong Q2 Earnings
Summary: LHN reported solid Q2 earnings and announced new co-living projects in Singapore and Malaysia. Revenue up 15% YoY driven by higher rental yields and lower vacancy rates.
Sentiment: Positive – supports bullish price breakout.
Final Summary & Price Outlook
| Time Frame | Bias | Summary |
|---|---|---|
| Short-Term | Bullish | Breakout from resistance at 0.495–0.515 with strong structure |
| Medium-Term | Bullish | Higher lows and recovery post deep pullback; upside to 0.550+ likely |
| Long-Term | Neutral to Bullish | Needs confirmation with breakout above 0.550 zone |
✅ Final Verdict: Bullish Bias with Breakout Potential Above 0.520
-
Look for daily close above 0.525 with volume for confirmation.
-
Watch reaction near 0.550 – a breakout above would mark a major structural shift to strong uptrend.
Disclaimer:Please note that this analysis is for educational purposes only and should not be taken as investment advice. Trading involves significant risk, and you should consult with a financial advisor before making any decisions.
Dividend: 3.88%

No comments:
Post a Comment