Saturday, December 31, 2022

Dow Jones

What does this stock chart says?

The Dow is still in a downtrend.  However, it seems to be holding its support for now.  Likely to drift sideways as there are no QE to boost the shares price.  


Friday, December 30, 2022

Frasers Log and Com - 30 Dec 22

What does this stock chart says?

Short-term bullish.  Important to break first resistance at 1.16 before entering intermediate bullishness.  


Thursday, December 29, 2022

Keppel Corp - 29 Dec 2022

What does this stock chart says?

Short-term weakness.

Long-term uptrend still not yet broken but look price chart look sluggish as uptrend already more than 10 months old.  


Wednesday, December 28, 2022

Frasers Centrepoint - 28 Dec 2022

What does this stock chart says?

Short-term is bullish but not yet out of the downtrend woods yet.


Tuesday, December 27, 2022

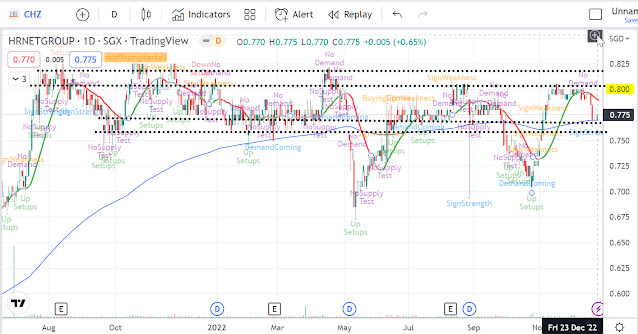
HRNetGroup - 27 Dec 2022

What does this stock chart says?

Best sell price at 0.80

The resistance and support price is quite tight, only 0.03 cents difference.  0.77 to 0.80


Monday, December 26, 2022

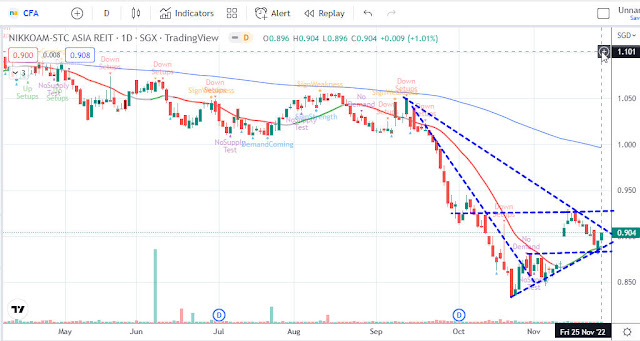
NikkoAM STC Asia Reit ETF - 23 Dec 2022

What does this stock chart says?

SG Reits intermediate uptrend have stopped.   Price action now moving sideways as no clear direction.

FED interest rate hike still ongoing and still dampen the REITS sector.


Sunday, December 25, 2022

STI - 23 Dec 2022

What does this stock chart says?

Mini sideway channel.  No clear signal yet, so will stay out of market.  


STI ETF same pattern as STI


Saturday, December 24, 2022

Dow Jones - 23 Dec 2022

What does this stock chart says?

Still looking bearish from the chart as price action is still at the lower channel.  Be cautious!  


Friday, December 23, 2022

Far East HTrust - 23 Dec 2022

What does this stock chart says?

Resistance are strong and price bouncing back to support at 0.58

FED interest rate hike is not over yet, so reits or biz trust have limited upside.


Thursday, December 22, 2022

Hotung Investment - 22 Dec 2022

What does this stock chart says?

Downtrend channel still intact.   

Mini-uptrend have hit resistance.  If no break up, likely to fall back to lower support of down channel.  


Tuesday, December 20, 2022

ESR Reit - 20 Dec 2022

What does this stock chart says?

Upper resistance line touch, likely to reversal back to support.  


Monday, December 19, 2022

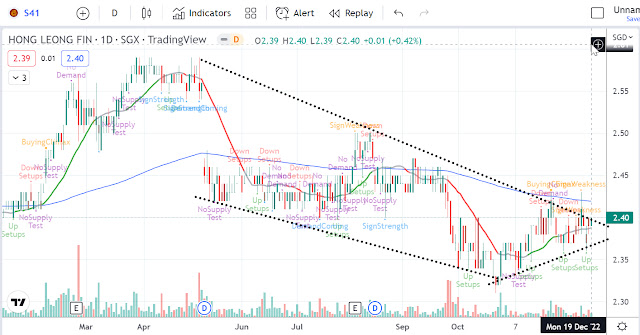
Hong Leong Finance - 19 Dec 2022

What does this stock chart says?

Long-term is down.

Short-term up.

As price at upper channel of downtrend, will avoid unless there is breakup with high volume.  


Sunday, December 18, 2022

STI - 16 Dec 22

What does this stock chart says?

Can see a mini down channel forming, similar to the Dow.

Next week likely to be bearish as it move towards the lower down channel.


Saturday, December 17, 2022

Dow Jones - 16 Dec 2022

What does this stock chart says?

Technically. look like oversold as the Dow quickly reached the support line.

Might see some technical rebound next week but the new mini down channel seem to be forming.  It is like telling you, sell on strength and buy on weakness.


Friday, December 16, 2022

EC World Reit - 16 Dec 2022

What does this stock chart says?

12 Dec strong buy but no continuation for the next 4 bars show that buyers are weak.

No change in long-term downtrend although it managed to stay above the downtrend line.


Thursday, December 15, 2022

Ho Bee Land - 15 Dec 2022

What does this stock chart says?

Long-term trend is down.

Short-term trend up.

Price will move narrowly in between the symmetrical_triangle.  


Wednesday, December 14, 2022

Daiwa Hse Log Trust - 14 Dec 2022

What does this stock chart says?

Long-term downtrend still intact.

As near pivot point, its either up or down.  Wait for direction.


Tuesday, December 13, 2022

Haw Par - Short-Term Bullish

What does this stock chart says?

Mid-term bullish.

Watch out resistance at 10.00

Long-term downtrend still not broken.


Monday, December 12, 2022

CDL HTrust - Downtrend

What does this stock chart says?

Buyers trying to push price above upper downtrend line but sellers are strong too.

With interest rate still high, upside is limited.  


Sunday, December 11, 2022

Lion OCBC Sec HSTech ETF HST - Postivie

What does this stock chart says?

As China start opening up, so does its share trend.


Saturday, December 10, 2022

Dow Jones - The First Wave

What does this stock chart says?

Market move in zig-zag, we will see a higher low and higher high structure.

The first wave up seems to be completed.  Watch out for the 2nd wave which is still the infant stage.  


Friday, December 09, 2022

Great Eastern - Higher Low Higher High

What does this stock chart says?

For uptrend continuation, it need to slowly move higher and higher.  


Thursday, December 08, 2022

CapLand IntCom - 08 Dec 2022

What does this stock chart says?

Forming a double top reversal.  

Likely to move sideways along the support line till clearer news from FED


Wednesday, December 07, 2022

Golden Argi-Res - Drop to Support

What does this stock chart says?

Drop to support, looking bearish.  Watch out for any further break down.  


Tuesday, December 06, 2022

CapLand India - Consolidating

What does this stock chart says?

Consolidation after recent run up.  


Monday, December 05, 2022

Global Inv - Consolidating

What does this stock chart says?

Consolidating and looking for direction after recent rebound.  


Sunday, December 04, 2022

STI - Resistance

What does this stock chart says?

STI at resistance.   

If next week cannot breakup confidently, likely to see a technical correction back to support at 3240


Saturday, December 03, 2022

Dow Jones - Indecision

What does this stock chart says?

Dow have up since 14 Oct 22.

Price now above previous resistance.  Either it goes further up or becomes an ugly double top reversal pattern.

Indecision, so better stay out till further confirmation.  


Friday, December 02, 2022

CapitaR China - Resistance

What does this stock chart says?

Taking a break at resistance after recent run-up.


Yield at 1.13

YearYieldTotalAmountEx DatePay DateParticulars
20225.22%SGD 0.059SGD0.03152022-08-022022-09-22SGD 0.0315 per security/unit
SGD0.00952022-08-022022-09-22SGD 0.0095 per security/unit
SGD0.0182022-02-092022-03-07Rate: SGD 0.018 Per Security
20216.65%SGD 0.075SGD0.0272021-10-192021-11-08Rate: SGD 0.027 Per Security
SGD0.04232021-08-052021-09-27SGD 0.0423 per security/unit
SGD0.00582021-02-052021-03-05Rate: SGD 0.0058 Per Security
20205.11%SGD 0.058-2020-11-24-Ratio: 56:1000
SGD0.0152020-11-242020-12-04Rate: SGD 0.015 Per Security
SGD0.01252020-11-242020-12-04Rate: SGD 0.0125 Per Security
SGD0.03022020-08-062020-09-28SGD 0.0302 per security/unit


Thursday, December 01, 2022

Delfi - Short-Term Uptrend

What does this stock chart says?

 Market news continue to be positive.  Short-term uptrend to continue.


Wednesday, November 30, 2022

CapLand Ascendas - Price Holding

What does this stock chart says?

Price holding well, waiting to break resistance in order to turn bullish.

Resistance 2.83

Support 2.68


Monday, November 28, 2022

DBS - Up Channel

What does this stock chart says?

Still bullish as price action still in up channel.


Sunday, November 27, 2022

NikkoAM STC Asia Reit - Technical Rebound

What does this stock chart says?

Still in technical rebound.  

SGS T-Bills, SSB rates are turning down.  If FED stop raising interest rate, Reits might make a come back as valuation are better now.


Saturday, November 26, 2022

AIMS APAC - Consolidating

What does this stock chart says?

Price likely to move around 1.20 to 1.28 as interest rate hike temporary ease due to less inflationary pressure.

News are dynamic and not permanent.  


Friday, November 25, 2022

CSE Global - Sideways

What does this stock chart says?

Price hovering around right issue price of 0.33

Not much action.


Thursday, November 24, 2022

Suntec - Mini Technical Rebound

What does this stock chart says?

Overall trend is down.

Mini up channel in motion.  


Yield at 1.39

YearYieldTotalAmountEx DatePay DateParticulars
20222.08%SGD 0.029-2022-11-032022-11-293 Cash Options
SGD0.003632022-11-032022-11-29Rate: SGD 0.00363 Per Security
SGD0.0022022-11-032022-11-29Rate: SGD 0.002 Per Security
-2022-08-032022-08-293 Cash Options
SGD0.006122022-08-032022-08-29Rate: SGD 0.00612 Per Security
SGD0.0022022-08-032022-08-29Rate: SGD 0.002 Per Security
SGD0.0022022-05-052022-05-30Rate: SGD 0.002 Per Security
-2022-05-052022-05-303 Cash Options
SGD0.005562022-05-052022-05-30Rate: SGD 0.00556 Per Security
SGD0.007652022-02-042022-02-28Rate: SGD 0.00765 Per Security
-2022-02-042022-02-283 Cash Options
20211.79%SGD 0.025SGD0.008182021-10-292021-11-29Rate: SGD 0.00818 Per Security
-2021-10-292021-11-293 Cash Options
-2021-07-292021-08-273 Cash Options
SGD0.006832021-07-292021-08-27Rate: SGD 0.00683 Per Security
-2021-04-302021-05-283 Cash Options
SGD0.003472021-04-302021-05-28Rate: SGD 0.00347 Per Security
-2021-02-022021-02-263 Cash Options
SGD0.006472021-02-022021-02-26Rate: SGD 0.00647 Per Security
20201.12%SGD 0.016-2020-10-292020-11-253 Cash Options
SGD0.003912020-10-292020-11-25Rate: SGD 0.00391 Per Security
-2020-07-302020-08-273 Cash Options
SGD0.003042020-07-302020-08-27Rate: SGD 0.00304 Per Security
-2020-04-292020-05-283 Cash Options
SGD0.000912020-04-292020-05-28Rate: SGD 0.00091 Per Security
-2020-01-302020-02-283 Cash Options
SGD0.002312020-01-302020-02-28Rate: SGD 0.00231 Per Security
SGD0.005442020-01-302020-02-28Rate: SGD 0.00544 Per Security


Wednesday, November 23, 2022

ComfortDelGro - Depressed Price

What does this stock chart says?

Super long-term price down channel with no end it sight yet.  


Yield at 1.23

YearYieldTotalAmountEx DatePay DateParticulars
20228.63%SGD 0.106SGD0.01412022-08-192022-08-29Rate: SGD 0.0141 Per Security
SGD0.02852022-08-192022-08-29Rate: SGD 0.0285 Per Security
SGD0.01412022-08-192022-08-29Rate: SGD 0.0141 Per Security
SGD0.02852022-08-192022-08-29Rate: SGD 0.0285 Per Security
SGD0.0212022-05-092022-05-27Rate: SGD 0.021 Per Security
20212.87%SGD 0.035SGD0.0212021-08-202021-09-02Rate: SGD 0.021 Per Security
SGD0.01432021-05-072021-05-20Rate: SGD 0.0143 Per Security
20204.30%SGD 0.053SGD0.05292020-06-012020-06-09Rate: SGD 0.0529 Per Security


Tuesday, November 22, 2022

StarHill Global - Resistance

What does this stock chart says?

1st resistance hit.

Watch if price perform a higher low and higher high.

Current trend is down.


Yield at 0.545

YearYieldTotalAmountEx DatePay DateParticulars
20226.97%SGD 0.038SGD0.00462022-08-042022-09-23SGD 0.0046 per security/unit
SGD0.01562022-08-042022-09-23SGD 0.0156 per security/unit
SGD0.01582022-02-032022-03-23SGD 0.0158 per security/unit
SGD0.0022022-02-032022-03-23SGD 0.002 per security/unit
20217.25%SGD 0.04SGD0.01842021-08-052021-09-24SGD 0.0184 per security/unit
SGD0.00232021-08-052021-09-24SGD 0.0023 per security/unit
SGD0.01792021-02-042021-03-25SGD 0.0179 per security/unit
SGD0.00092021-02-042021-03-25SGD 0.0009 per security/unit
20203.36%SGD 0.018SGD0.0072020-08-052020-08-28SGD 0.007 per security/unit
SGD0.00972020-02-052020-02-28Rate: SGD 0.0097 Per Security
SGD0.00042020-02-052020-02-28Rate: SGD 0.0004 Per Security
SGD0.00122020-02-052020-02-28Rate: SGD 0.0012 Per Security


Singapore Stock Investment Research