Tuesday, July 30, 2024

Netlink NBN Trust - 30 July 2024

What does this stock chart says?

Price look stable and likely to remain positive.


Monday, July 29, 2024

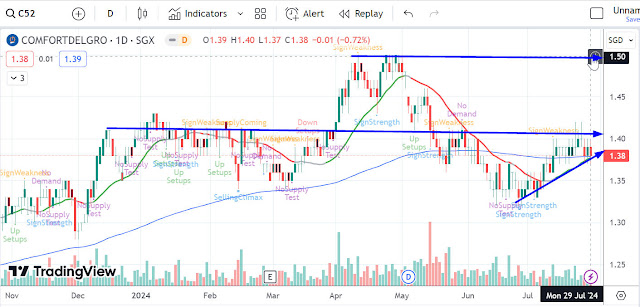
ComfortDelGro - 29 July 2024

What does this stock chart says?

Bullish.   Likely to re-visist resistance at 1.50


Sunday, July 28, 2024

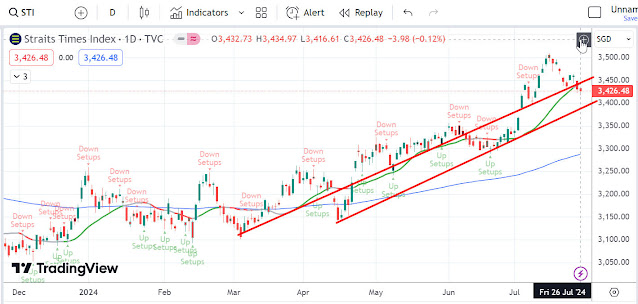
STI - 26 July 2024

What does this stock chart says?

STI following the Dow, likely to remain trending up till the US November Election.


Friday, July 26, 2024

Paragon Reit - 26 Jul 2024

What does this stock chart says?

Moving along the support line.   0.90 seem a tough resistance for now.


Thursday, July 25, 2024

Haw Par - 25 July 2024

What does this stock chart says?

Price is trending up slowly.  Resistance at 10.70 seem hard to break.


Wednesday, July 24, 2024

Kep Infra Trust - 24 July 2024

What does this stock chart says?

Long-term downtrend.


Tuesday, July 23, 2024

Keppel Corp - 23 July 2024

What does this stock chart says?
 
Mini uptrend.  Need to break 6.80 to continue upwards.


Monday, July 22, 2024

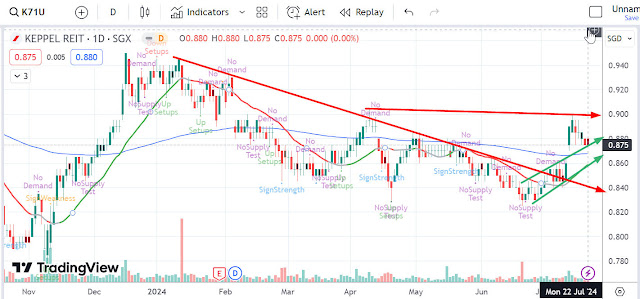
Keppel Reit - 22 July 2024

What does this stock chart says?

Facing resistance price block at 0.90   

Consolidating to determine long-term direction.


Sunday, July 21, 2024

STI - 19 July 2024

What does this stock chart says?

Tehncial correction, yet to break important support line.


Wednesday, July 17, 2024

CSE Global - 17 July 2024

What does this stock chart says?

Market is bullish.  CSE Global is bullish too.


Tuesday, July 16, 2024

Keppel DC Reit - 16 July 2024

What does this stock chart says?

July 12 24 hit Buying Climate which is the point of resstance.

Price action need to remain in the up channel to remain bullish.


Monday, July 15, 2024

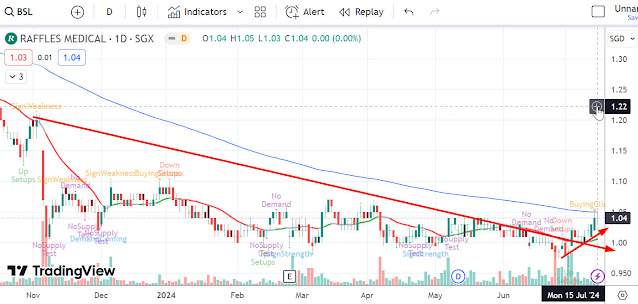
Raffles Medical - 15 July 2024

What does this stock chart says?

Looking bullish.  Seem like smart monies is rotating stock to move up.


Sunday, July 14, 2024

NikkoAM STC Asia Reit ETF - 14 Jul 2024

What does this stock chart says?

Two large bullish bar appear on the last 2 days.  We be seeing more positive REITS price action next week.


Friday, July 12, 2024

Frasers Log and Com - 12 July 2024

What does this stock chart says?

Increasing high-volume break out.  Lights is coming for REITS investor.


Wednesday, July 10, 2024

Sheng Siong - 10 Jul 2024

What does this stock chart says?

Downtrend channel.  Support holding at 1.45


Tuesday, July 09, 2024

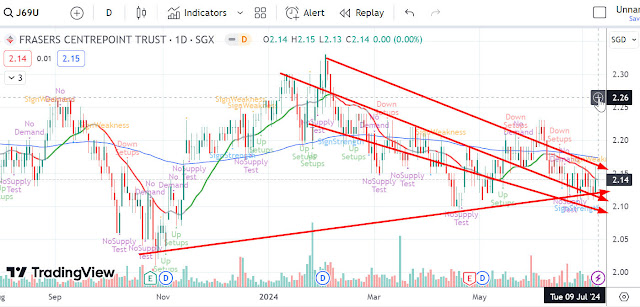
Frasers Centrepoint - 09 July 2024

What does this stock chart says?

Neither up nor down.  Consider one of the better reits chart.


Monday, July 08, 2024

iFast - 08 July 2024

What does this stock chart says?

Uptrend Channel - Trending up slowly.


Friday, July 05, 2024

Mapletree PanAsia - 05 July 2024

What does this stock chart says?

Downtrend started on 08 Nov 2021


Thursday, July 04, 2024

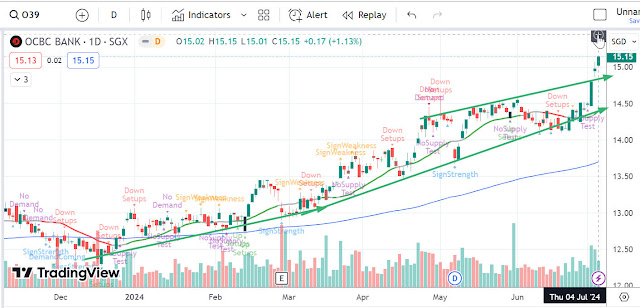
OCBC - 04 July 2024

What does this stock chart says?

OCBC have reached the highest share price never seen before.  Likely to remain high for longer.
n

Wednesday, July 03, 2024

UOB - 03 July 2024

What does this stock chart says?

Previous high hit on 17 Feb 2022 @ 33.33 

Today UOB hit a new high @ 32.45

Banks share price are higher for longer, same trend as the Fed interest rate. 


Tuesday, July 02, 2024

Mapletree Log - 02 July 2024

What does this stock chart says?

When 2 long arrow pointing down, better listen to chart and stay away till the trend changes.

Downtrend started on 29 Dec 2023 @ 1.74


Monday, July 01, 2024

DBS - 01 July 2024

What does this stock chart says?

Good momentum for 01 July 2024.  You need to go further up with high volume to be convicing.


Singapore Stock Investment Research