Sunday, December 31, 2023

Frasers Property - 29 Dec 2023

What does this stock chart says?

Look bullish as price was going up for the past 6 weeks, but when look at chart, it still in a long-term DOWN trend.  0.94 is a formidable resistance.


Saturday, December 30, 2023

STI ETF - 29 Dec 2023

What does this stock chart says?

Enter the 3rd of bullish bar, current week is the largest bar.

FED cutting interest rate news is still on play, so far NO new bad news and the rally might stall or continue.  Take note that many stock price are near the incoming resistance.  Need to be cautious even though high can still go higher.  The Greater Fool theory.

My current strategy is to continue to sell some stocks as the STI goes higher as we can never know how high it will go.  Buying will be a no go for now.


Venture - 29 Dec 2023

What does this stock chart says?

8 weeks of bullish bar and price is now near the incoming resistance around 14

Be cautious.


Thursday, December 28, 2023

Hong Leong Finance - 28 Dec 2024

What does this stock chart says?

Price action is kind of flat.  

Support     2.45   

Resistance 2.50  


Wednesday, December 27, 2023

Sheng Siong - 27 Dec 2023

What does this stock chart says?

Very tight range, if you wish to buy for dividends 1.56 is a reasonable support price.


Friday, December 15, 2023

Nikko STI ETF - 15 Dec 2023

What does this stock chart says?

Nikko ETF remains sluggish as STI contains mainly banks which are not in favor now.


Wednesday, December 13, 2023

SGX - 13 Dec 2023

What does this stock chart says?

Moving within the down channel.  


Tuesday, December 12, 2023

CSE Global - 12 Dec 2023

What does this stock chart says?

This kind of pattern is the worse, neither down or up.  


Friday, December 08, 2023

Mapletree Ind - 08 Dec 2023

What does this stock chart says?

Price action looking positive as it is staying above the long-term downtrend line.


Wednesday, December 06, 2023

Ascendas Reit - 06 Dec 23

What does this stock chart says?

Resistance met.  Wait for further direction.  


Monday, December 04, 2023

Venture - 04 Dec 2023

What does this stock chart says?

Turning positive if it remains above the downtrend line.


Sunday, December 03, 2023

STI - 03 Dec 2023

What does this stock chart says?

Divergent

STI flat and down while Dow enjoying a rally to reach resistance.  


Friday, December 01, 2023

Keppel DC Reit - 01 Dec 2023

What does this stock chart says?

Current mood is FED rate hike ending, so REITS getting bullish?  

Hmmm, so far so good........


Thursday, November 30, 2023

ST Eng - 30 Nov 2023

What does this stock chart says?

Sliding in the down channel.


Saturday, November 25, 2023

Nikko STI ETF - 24 Nov 23

What does this stock chart says?

Nikko STI ETF looks week as it is inside the down channel.  


Thursday, November 23, 2023

CapLand Ascendas - 23 Nov 2023

What does this stock chart says?

Fourth week of up bars and now had hit the resistance line.  A breakout is required to see a further uptrend, else will technical correction to around 2.70.  


Wednesday, November 22, 2023

Venture - 22 No 2023

What does this stock chart says?

Mini rally resistance met.  Expect sideways movement.  


Tuesday, November 21, 2023

ThaiBev - 21 Nov 2023

What does this stock chart says?

Clear downtrend.


Monday, November 20, 2023

ComfortDelGro - 20 Nov 2023

What does this stock chart says?

Resistance hit.  In consolidation.


Saturday, November 18, 2023

Nikko STI ETF - 17 Nov 2023

What does this stock chart says?

Seem stuck at the lower support and resistance.  


Thursday, November 16, 2023

CapitaR China - 16 Nov 2023

What does this stock chart says?

Resistance at 0.84 ?  Next few bars will tell.  


Wednesday, November 15, 2023

Frasers Log and Com - 15 Nov 2023

What does this stock chart says?

Retts rebound day.  However, not a time for rejoice yet and still in downtrend.


Tuesday, November 14, 2023

Capland Ascott - 14 Nov 2023

What does this stock chart says?

Can't escape the down channel.


Monday, November 13, 2023

STI - 10 Nov 2023

What does this stock chart says?

Stuck in the down channel.  


Thursday, November 09, 2023

Singtel - 09 Nov 2023

What does this stock chart says?

Price need to stay above 2.45, else will be weak and bounce back and forth sideway.


Wednesday, November 08, 2023

SIA - 08 Nov 2023

What does this stock chart says?

Downtrend line intact.  Just a technical rebound.


Tuesday, November 07, 2023

SembCorp Ind - 07 Nov 2023

What does this stock chart says?

Very bullish bar today. Likely to continue.  


Monday, November 06, 2023

Keppel DC Reit - 06 Nov 2023

What does this stock chart says?

Interesting begin for the week.  Price hit resistance.  Next few days price bars is important to watch.


Sunday, November 05, 2023

STI - 05 Nov 2023

What does this stock chart says?

STI put up a great rebound but don't be too happy yet if price just rest a resistance.  Need a powerful break up of resistance next week.


Saturday, November 04, 2023

Dow Jones - 04 Nov 2023

What does this stock chart says?

Next week is important, whether will it break resistance or not?


Wednesday, November 01, 2023

OLAM - 01 Nov 2023

What does this stock chart says?

Nothing more than a technical rebound.  Downtrend intact.


Tuesday, October 31, 2023

Golden Argi-Res - 31 Oct 2023

What does this stock chart says?

Price is outside of the down channel.  However, price looks weak and likely to fall back and continue its downtrend.  Bearish.


Monday, October 30, 2023

Mapletree PanAsia - 30 Oct 2023

What does this stock chart says?

Can see the current down channel in play.  Bearish.  


Wednesday, October 25, 2023

Mapletree Log - 25 Oct 2023

What does this stock chart says?

Price support at current level.  Technical rebound near 1.65  


Sunday, October 22, 2023

STI - Oct 20 2023

What does this stock chart says?

Looking for good support near 3000.

Price action moving within the mini down channel.


Dow Jones - 20 Oct 2023

What does this stock chart says?

Good support near 32000.  

Falling in line accordingly to the mini down channel.


Friday, October 20, 2023

Haw Par - 20 Oct 2023

What does this stock chart says?

Long-term is down. Price within the downtrend line.  


Wednesday, October 18, 2023

DBS - 18 Oct 2023

What does this stock chart says?

Long-term trend still bullish.  Not breaking new high.  Price moving sideways despite interest still high.  Smart monies waiting for the right news to break the top structures.


Tuesday, October 17, 2023

Keppel Corp - 17 Oct 2023

What does this stock chart says?

Long-term trend is bullish, however, it cannot break higher high and is turning bearish.


Monday, October 16, 2023

Mapletree Ind - 16 Oct 2023

What does this stock chart says?

Price below 200 MA which represent bearishness.  


Sunday, October 15, 2023

Nikko STI ETF - 13 Oct 2023

What does this stock chart says?

Unexciting as keep moving sideways.  No need to talk much. :-)


S&P 500 - 13 Oct 2023

What does this stock chart says?

Long-term trend still up.  Short-term is down as it is moving inside the min-channel.  

Uptrend will be disrupted if it break the lower up channel support.


Friday, October 13, 2023

Wilmar - 13 Oct 2023

What does this stock chart says?

When the long-term trend is done, it will just continue till there is a reversal.  Any rebound is to a sell at resistance.


Thursday, October 12, 2023

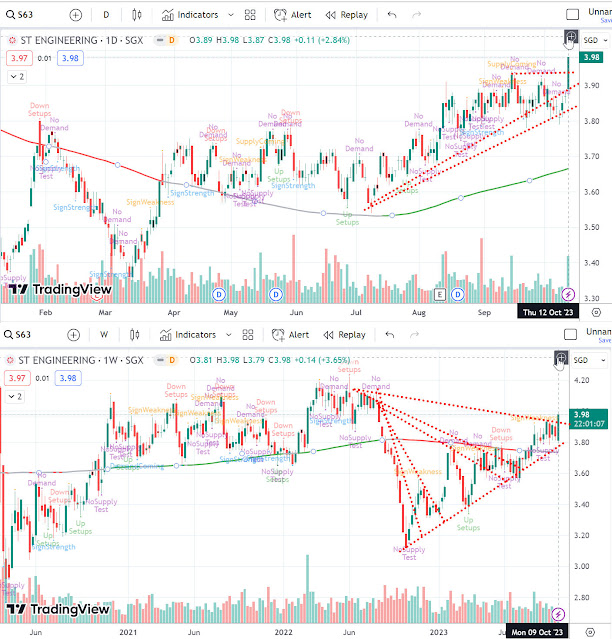
ST Eng - 12 Oct 2023

What does this stock chart says?

Very bullish bar today.  Tomorrow will be decisive whether the rally can continue.  


Wednesday, October 11, 2023

Singtel - 11 Oct 2023

What does this stock chart says?

Resistance 2.58

Support 2.30

Trending slowly downwards.  


Tuesday, October 10, 2023

Mapletree PanAsia - 10 Oct 2023

What does this stock chart says?

Buyer beware, now caught in a down channel.


Monday, October 09, 2023

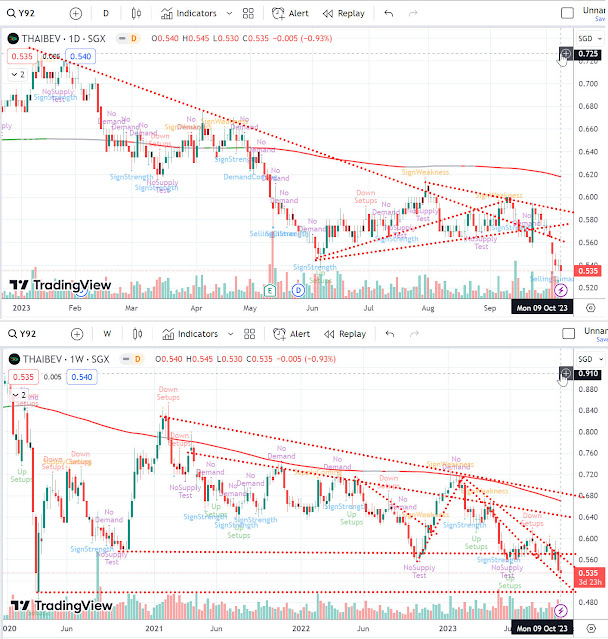
ThaiBev - 09 Oct 2023

What does this stock chart says?

Daily and Weekly chart in sync, downtrend continuation.


Sunday, October 08, 2023

SGX - 06 Oct 2023

What does this stock chart says?

Daily chart shown an uptrend continuation.  

Weekly chart shows that there is trend continuation too, both are in sync.  However, price is also the peak, therefore the risk and reward is not that great anymore.  Price can continue to go higher but risk is also very high for those who enter at current price.


STI ETF - 06 Oct 2023

What does this stock chart says?

The selling climate seem to be over for now.   Likely to be listless next week as market wait for clearer direction. 


Saturday, October 07, 2023

Dow Jones - 07 Oct 2023

What does this stock chart says?

Based on chart, it seem the Dow is ready for a technical rebound back to 34000.  Keep watch next week.


Singapore Stock Investment Research