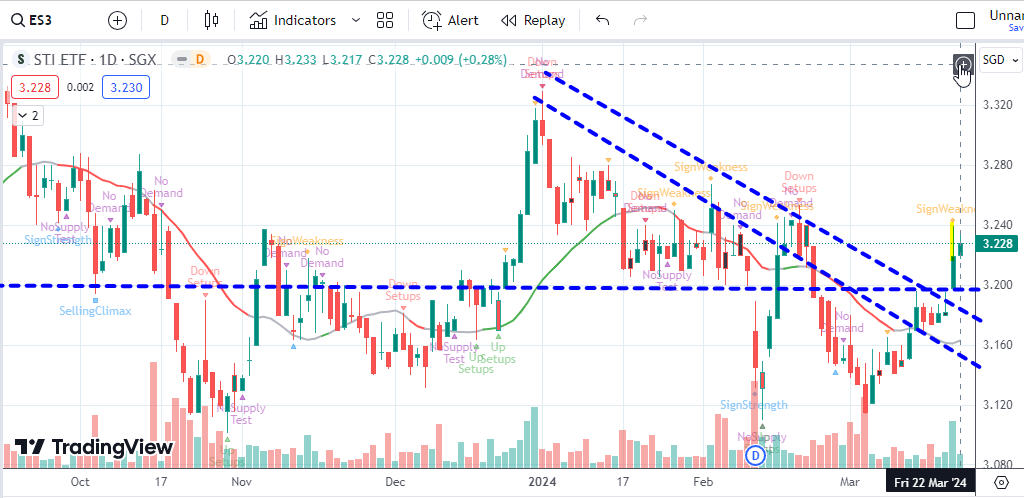
Watch the 2nd resistance. Only a high volume break can change the down trend. If not, take your money and run if price keep hovering around the 2nd resistance.
My September 2026 Personal Spending – $1336
-
I would periodically update everyone my personal spending. This is the
update for this month. You can review my past spending logs by going to …
Best Electricity Plans In Singapore (October 2026)
-
Are you overpaying for electricity in Singapore? Discover how to easily
switch from the default SP Group tariff to the best fixed,
discount-off-tariff, a...
Corporate Life Isn’t a Prison: Enemy or Partner?
-
Is corporate life a soul-crushing prison or a partner in financial
independence? A reflective look at why the corporate machinery is a
crucible for growth,...
US ISM PMI fell marginally in September 2026.
-
Missing parameter:
Estimated Local New Orders: New orders - New Export Orders = 1.6 - (-2.3) =
3.9
Estimated Local Material: Inventories - Imports = (-2)...
Nineth Month of Phase 1 Barista FIRE
-
This post is just for personal reference, to record my personal income and
expenses in my journey towards Barista FIRE.
For the month of September, it wa...
Dividend and portfolio update September 2026
-
Added the following stocks this month :
SCB SDR
Lum chang creation
Samsonite
Dunelm
S & U
Dividend payment dates as of time of writing this (those p...
September 2026 Updates
-
If I have to use one word to describe September, it would be "busy" - for
personal, work and investing.
Whatever pockets of time I have recently are spent...
My Investment Portfolio (September 2026)
-
STI ended 3rd quarter of the year at 5675 points, down around 1.4% for the
month. September had again been a weak month for the markets as concerns on
in...
DBS & OCBC already moved… is UOB next?
-
DBS has already had a strong run.
OCBC too.
Both bullish trends are still holding.
But now…
*UOB is getting interesting. *
...
Survive first. Compounding will do the rest
-
Most investing advice focuses on finding the next big winner. Far less is
written about the quieter discipline that often determines whether you
finish w...
39 financial tips for my 39th Birthday
-
I am celebrating my 39th Birthday this month.
Thus, I would like to share my personal 39 financial tips with everyone....
Slow and Steady Climb So Far in 2026
-
Wow this year has been flying by. I’ve not updated this blog since the
start of the year. Sorry to my neglected blog! Since that
The post Slow and Steady...
What We’re Reading (Week Ending 27 September 2026)
-
The best articles we’ve read in recent times on a wide range of topics,
including investing, business, and the world in general.
The post What We’re Read...
Our CPF at the maximum ...
-
A Singaporean household of 3.
2 working adults, age 46 (1980s) and 1 young adult age 14.
Voluntary Housing Refund (VHR) all monies back to CPF OA!
unti...
FIRE by 40: Sometimes, Progress Means Doing Less
-
What if the biggest progress in my financial independence journey over the
past three months wasn’t how much money I made, but how my relationship
with m...
My Investment Portfolio - SG (End Aug 2026)
-
*Source: StocksCafe*
Transactions made:
- Sold 2,500 units of Cent Accom REIT at $1.16
- Bought 200 units of UOB at $42.1
Centurion Accommodation ...
Quick thoughts on my investments
-
This is just a short post to organize my thoughts on where things currently
stand with my investments, career, and overall journey. Life & Career
Updates O...
SGD 2 million milestone Portfolio
-
A few days ago, I achieved an SGD 2 million milestone portfolio just a few
days prior to my 41st birthday. This number is a major personal milestone
in m...
iFAST Q2 2026: Solid numbers, softening momentum
-
Disclosure: I own shares of iFAST and this post isn’t investment advice.
“For the Hong Kong ePension project, all 12 trustees and a total of 24
schemes hav...
Why Trading Consistency Beats Intensity
-
Discover the real reason why trading consistency beats intensity, and how
you can turn consistency into consistent profits
The post Why Trading Consisten...
May 2026 Portfolio Update
-
Both S&P and STI is about 10% at the moment, while HSI is looking at about
negative 1%.
This year is not a great year... I am on 4% at the moment, which ...
20 Years On!
-
20 years is a long time. This blog started in 2006. So it has been *20
years*.
This blog started in 2006. Fuck. It's been that long...
In that time fra...
Want $1.33m CPF savings & $240k passive income?
-
Hello everybody!This is AK.I am back!Time for another update.I talked about
how I achieved financial nirvana in a YouTube video a few months ago and
also h...
A new year, a new workplace, a new start
-
Focus on the learning new things in the new workplace, indeed the profile
or rather the culture of the school is different.
Over the next few years, I ...
Cory Diary : Family Expense Dec'25
-
Dec'25 seen some temporary uptick in expenses. This is after months of
sloping down in expenses.The increase is more on oversea accommodation
expenses. I d...
Restarting on Substack...
-
*It’s good to be back.* I’ve finally carved out the time to return to
Substack, and I’m hitting the ground running. My latest thesis is the most
critical...
Loopholes Singapore is on YOUTUBE!
-
LoopholesSG is renamed as 12Trade on YouTube! I will be compiling some of
the content from the blog, enhance with AI of course and
For more articles on f...
What Shall We Do About VERS?
-
VERS (Voluntary Early Redevelopment Scheme) in Singapore is a buyback
programme for HDB flats that are around 70 years old
The post What Shall We Do Abou...
A Heartfelt Farewell – Stepping Back from the Blog
-
Since starting this blog on 1 January 2019, I’ve spent countless hours
creating posts, charts, and resources about Singapore REITs. Over the
years, it ha...
Is Suntec REIT A Good Buy Now In 2025?
-
Suntec REIT (SGX: T82U) is one of the pioneer composite REITs in Singapore,
with income-producing real estate primarily used for office and retail
purposes...
60% of Singaporeans Live Paycheck to Paycheck
-
A recently published report from global payroll and HR solutions provider
ADP featured in a Singapore Business Review article reveals a staggering
truth ...
Top 10 Highlights of 2024
-
As a dragon baby navigating the Year of the Dragon, it is inevitable that I
experienced more downs than ups in 2024. Whether it is at work, familial
rela...
The Stigma against Early Retirement (FIRE)
-
Retirement is a word that invokes fear.
The fear of not having enough money to retire. The fear of money running
out during retirement. The fear of the r...
Starting on a new telegram channel
-
Hi everyone! It’s been a few months since our last update. When we first
started in 2021, we wrote our updates quite regularly, and we want to see
if we ca...
APAC Markets: First Trends in 2024
-
Last year’s high flyer Japan led the list of the best-performing markets in
Asia-Pacific in January. Our regular ranking of the stock markets in
Asia-Pac...
2023 Review – How is Miss Niao after 8 years?
-
2023 marks the 8th year since the birth of this blog, and the first year of
life of my baby girl. Life is different when two becomes three. Life seems
to b...
Rolf 2023 in Review, Looking forward to 2024!
-
Happy new year to all. This post came late. But better late than never,
:-). Looking back, 2023 has been one of the most eventful
The post Rolf 2023 in R...
Dear friends of CW8888
-
Dear friends,
My family and I would like to express our thanks for the many kind thoughts
and messages extended our way over the past weeks, particularly...
Farewell, Uncle CW8888
-
On 8 April 2023, I lost a friend.
To honour the memory of Uncle CW8888, let me share a few nuggets of wisdom
I have learned from him as well as some of t...
To my beloved friend CW8888
-
It is with infinite sadness that I came out from my hiding hole to blog
about the passing of a dear friend, CW8888, whom I affectionately call
senior bro...
Takeaways from “Sea Change”
-
Howard Marks, a billionaire and founder of Oaktree Capital Management, is
known to be a critical thinker and he shares his views openly in his memos.
He ...
Cryptocurrency
-
Believe by now majority should have heard about the crypto crash.
There was quite a number of times, my PYM subscribers asked why am I not
into crypto as t...
What Is Money?
-
What is money? M1 is a measure of the country’s money supply. This includes
all currency held by the public, and all transaction deposits in depository
i...
Bumitama Agri: Reaping a bumper harvest
-
Bumitama Agri has caught my attention recently. According to DBS, it is
trading below its average PE multiple, and far below the multiple of its
peers. I a...
Are crypto the new stocks?
-
Your takeaway: Crypto tokens are flexible creations. Many crypto tokens
were created with a strong similarity to stocks, which make them …
Continue read...
Manulife US REIT: A Positive Strategy Divergence
-
Fuelling the Next Leap in Growth through the Sun Belt and Emerging Markets
by: Tam Ging Wien
------------------------------
*All examples and stocks quote...
Guide to HDB Resale Application (Without Agent)
-
1. Register Intend to Buy
This is the very first step to do and a very simple application to register
your intend to purchase a flat. The application is ...
CPF Balances Update – June 2021
-
It is the end of June with all mandatory contributions in for the month. SA
balance currently stands at $129,039.53, more than half of 2021 FRS or
69.4% of...
New Email Delivery Services - Follow It
-
This post is intended for long time followers of Singapore IPOs and SRS
Retirement Fund who have been receiving daily email updates. As Feedburner
has deci...
New Email Delivery Services - Follow It
-
This post is intended for long time followers of Singapore IPOs and SRS
Retirement Fund who have been receiving daily email updates. As Feedburner
has deci...
Straits Times Index (Week of 7 June 2021)
-
The Straits Times Index (STI) opened this Monday morning at 3,169.69
points, how will it fare in the near future?
After reopening most of Singapore's ec...
GMS Short Term now Risk-Off [Mid-week update]
-
Meaningful spike in the $VIX as mentioned in our post on Sunday with the
$VIX now decently above 20. Conditions are still deteriorating across asset
classe...
How much can you put in your Medisave Account?
-
It has been ages since i’ve written anything. Ever since we came out of
lock down the option to work from home no longer existed for Mr Kua Simi.
It didn’t...
CPF Top Ups
-
I took a leap of faith and decided into topping up my CPF Medisave Account
yesterday.
Amidst the frenzy market movements so far, I always wonder if giving...
Trading Idea: Long SGD/TKX
-
1. TKX has broken 100-day mark and it is gaining momentum.
2. With the rising momentum and diminishing supply, it is expected to
test the 0....
weekly review #5 2020
-
*Thoughts*
There's a new bug in town, and it is causing quite a bit of scare.My
trading positions are down, in fact my income positions too!but i guess
thi...
Portfolio as of 31 December 2019
-
The counters on the SGX that I am holding as of 31 December 2019 are as
follows:
and on the Bursa are as follows:
A counter that appears both h...
2019 Portfolio Review
-
I am becoming lazy to doing updates...
Time flies and 2019 is gone. All my tradings are done and all dividends
are collected. It is time to do a final r...
DEBT, DEBT, DEBT!
-
Date: 2019-07-17
Source: IMF blog
Article 1: https://blogs.imf.org/2018/04/18/bringing-down-high-debt/
Global debt hit a new record high of $164 trillion i...
Being Frugal or Being Cheapskate?
-
Everyone is born with a different spoon in their mouth. Some entered the
world with a golden spoon right up while some are out with a plastic one.
Nonethel...
Portfolio Update - 2018 Aug
-
What a way to end my first year of investing journey! My two top holdings:
the AA tag team, AEM & AMAL, were whacked upside down furiously. Could
never ima...