Thursday, October 31, 2024

STI ETF forms bearish Double Top chart pattern

What does this stock chart says?

Trading Central has detected a "Double Top" chart pattern formed on STI ETF (ES3:SGX-ST). This bearish signal indicates that the stock price may fall from the close of 3.614 to the range of 3.520 - 3.540. The pattern formed over 32 days which is roughly the period of time in which the target price range may be achieved, according to standard principles of technical analysis.

Tells Me: The price seems to have reached a top, after failing to break through a resistance level and ultimately breaking downward in a sign of reversal to a new downtrend.

The Double Top pattern forms during an uptrend as the price reaches two distinct peaks at roughly the same price level. Volume reflects a weakening of the upward momentum, tending to diminish as the pattern forms, with some pickup at each high, less on the second high. Finally the price breaks down below the lowest low to confirm the bearish signal.

This bearish pattern can be seen on the following chart and was detected by Trading Central proprietary pattern recognition technology.


Tuesday, October 29, 2024

Genting SP - 29 Oct 2024

What does this stock chart says?

Mini Bearish Down Channel, moving towards 0.80.  Wait for it to complete.

P/E Ratio   14.83

Dividend Yield  4.62%


Monday, October 28, 2024

BRC Asia - 28 Oct 2024

What does this stock BEC chart says?

Uptrend still intact but looking weak as unable to break the 2.40 resistance line.

P/E Ratio   7.42

Dividend Yield   6.93%


Sunday, October 27, 2024

STI - 27 Oct 2024

What does this stock chart says?

2nd Red bar for the past 6 weeks.  High chance of technical correction next week.


Saturday, October 26, 2024

Dow Jones - 25 Oct 2024

What does this stock chart says?

Next week an important week to watch as price fall on the uptrend support.  If it failed, we are likely to see a technical correction towards 41,000.


Friday, October 25, 2024

SIA - 25 Oct 2024

What does this stock chart says?

When upper resistance and lower support line look similiar, stay sideline and wait for breakout direction.

P/E Ratio   7.19

Dividend Yield   7.22%


Thursday, October 24, 2024

Delfi - 24 Oct 2024

What does this stock chart says?

Bullish.  Slow and steady.

P/E Ratio   9.60

Dividend Yield   5.84%


Wednesday, October 23, 2024

CapLand India - 23 Oct 2024

What does this stock chart says?

Chart looking bearish.  Price remains outside the uptrend line.  

P/E Ratio   8.39

Dividend Yield   5.9%


Tuesday, October 22, 2024

Q&M Dental - 22 Oct 2024

What does this stock chart QC7 says?

Chart is bullish.  Price slowly moving up.  Waitng for that breakout movement.  

P/E Ratio   16.86

Dividend Yield    3.26%


Friday, October 18, 2024

PropNex 18 Oct 2024

What does this stock chart says?

Good support price to buy some.  

P/E Ratio  13.06

Dividend Yield   7.28%


Thursday, October 17, 2024

Capland Ascott - 17 Oct 2024

What does this stock chart says?

Technical correcction as the play now is inflation again.

P/E Ratio  14.84

Dividend Yield   5.97%


Wednesday, October 16, 2024

ThaiBev - 16 Oct 2024

What does this stock chart says?

Still bullish, waiting for the right news to move up.  

P/E Ratio   13.18

Dividend Yield   4.24%


Tuesday, October 15, 2024

UOB Kay Hian - 15 Oct 2024

What does this U10 stock chart says?

Price at lower support uptrend channel.  High chance of going into a tehnical correction.  

P/E Ratio   6.73

Dividend Yield   5.86%


Monday, October 14, 2024

CapLand IntCom Trust - 14 Oct 2024

What does this stock chart says?

Expect a techncial correction to 2.02 as the play now is on inflation data not favourable again.  ;-)  

P/E Ratio   16.60

Dividend Yield   5.22%

Analyst rating 1 year target 2.31


Friday, October 11, 2024

Boustead SP - 11 Oct 2024

What does this stock chart says?

Failed to push through the resistance of 1.05

Techncial correction towards support of 0.95

P/E Ratio  7.66

Dividend Yield  5.34%


Thursday, October 10, 2024

Hong Leong Finance - 10 Oct 2024

What does this stock chart says?

Niether Up or Down.

P/E Ratio  =  11.07

Dividend Yield  = 5.20%


Wednesday, October 09, 2024

Ascendas Reit - 09 Oct 2024

What does this stock chart says?

Price in technical correction.  2.80 is a good support price.  

P/E Ratio = 81.63 

Dividend Yield = 5,34%


Tuesday, October 08, 2024

SBS Transit - 08 Oct 2024

What does this stock chart says?

Good support price to buy some for dividends.  Not suitable for trading.

Dividend Yield   4.61


Monday, October 07, 2024

UOI - 07 Oct 2024

What does this stock chart says?

Price moving out of the uptrend line.  Technically showing sign of weakness.  


Sunday, October 06, 2024

Lion-OSPL APAC Fin ETF - 04 Oct 2024

What does this stock chart YLD says?

Price moving along the resistance level for  the past 11 days.  The Finance sector seems stuck with the FED interest rate cut.


Saturday, October 05, 2024

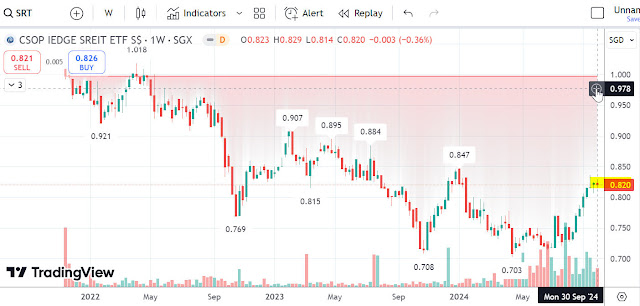
COSP iEdge SReit ETF - 04 Oct 2024

What does this stock chart says?

Last 3 weeks bar look similiar to STI, sign of weakness.  Looking towards a technical correcton.


STI - 04 Oct 2024

What does this stock chart says?

Last 3 bars stuck in same range, likely to see a technical correction next week.  


Friday, October 04, 2024

StarHill Global - 04 Oct 2024

What does P40U stock  chart says?

20 up bars = 1 month of up bars.

Forming a double head, buyers getting weak, expecting a techncial correction.

]
 m

Thursday, October 03, 2024

UOL - 03 Oct 2024

What does this stock chart says?

Uptrend still work-in-progress.


Wednesday, October 02, 2024

Wilmar - 02 Oct 2024

What does this stock chart says?

If price continue to hold around 3.20, then chance of upside will be higher.


Tuesday, October 01, 2024

Venture - 01 Oct 2024

What does this stock chart says?

Technical chart shows price getting bearish.  Wait for break out direction.


Singapore Stock Investment Research